
Part 1
Most people know that SSDs are fast with high IOPS and mechanical disks are slower, offering less speed per unit and lower IOPS, but a better cost per TB. Most “high end” enthusiast SSDs (read: consumer) these days will offer 400+ MB/s and at least 70k IOPS at medium queue depths. Mechanical disks might only offer 75 – 140 IOPS per disk and 100 – 125 MB/s transfer. However, we also know that we can combine multiple disks in one array and multiply our IOPS and overall throughput at the same time. But, when does this make sense and what are some example situations like? Part 1 of this article is focusing on bandwidth/speed of the arrays while Part 2 will focus on the IOPS and other performance factors. Read on!
My ESXi server is equipped with two SSDs (a Crucial MX100 256GB and a Samsung 850 Evo 250GB), a RAID10 array off of local storage comprised of eight Western Digital Caviar Black 1TB drives (attached to an LSI 9260-8i controller), as well as five Western Digital Caviar Red 4TB drives attached via iSCSI with two 1 GBe interfaces on the host and four 1 GBe interfaces on the target (Synology DS1513+) in LACP. Soon, I’ll be upgrading the local storage to eight Western Digital Caviar Red 4TB drives and am going to test out RAID10 and RAID50 performance. I will likely resort to RAID50 as I do not need as much performance as RAID10 offers considering I have the two internal SSDs should I need speed for a VM.
So, in short, my entry here is targeted toward displaying how these different configurations perform in a homelab/homeserver situation. Remember, these are consumer SSDs, consumer SATA drives, and relatively low spindle-counts. In an enterprise scenario you might do a similar test but with 24 disks, etc. So, keep in mind the test involving the mechanical disks will scale and with these being 5400/7200RPM SATA disks, performance increases will when going to 10k and 15k RPM SAS drives.
Now onto some results. I have a VM I call ConwayTS1 which is my terminal server that I use as a jump point and have all my software I might use to administer my network. Anyway, that VM has CrystalDiskMark installed and I migrated it around to different datastores and ran the test. This is convenient in that the only thing that changes is the storage that the VM is on. However, it should be noticed that some datastores/storage locations do have other things running on them during the time of the test. For example, when I tested a RAID5 array on a Synology DS1513+ it has literally 90% of my VMs on it right now because I am preparing to replace my internal storage on my ESXi server. So, that array is noisy in terms of VM chatter and as a result, the results suffer. I cannot remove all the VMs from the RAID5 datastores just yet, so the RAID5 test is a bit slower than I would expect. It’s also connected via iSCSI with only two 1GBe NICs – its a temporary storage point right now for this ESXi host.
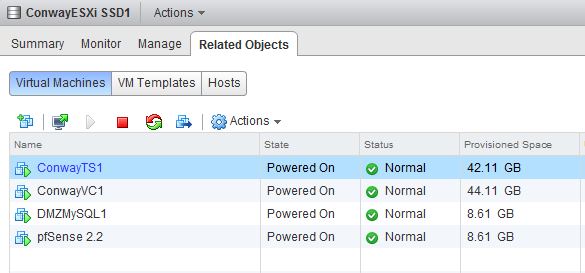
The first results I will post are from “SSD1” – this is my Crucial MX100 256GB SSD:
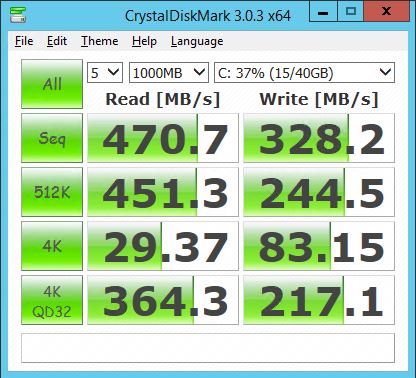 You’ll find above a nice Sequential read of 470 MB/s and write of 328 MB/s. This is not bad considering the price point of the MX100 unit. The 4K read and write are what you want to look at in terms of “quickness” – these speeds would reflect something like throughput during an OS boot or a situation where many small files are flung around.
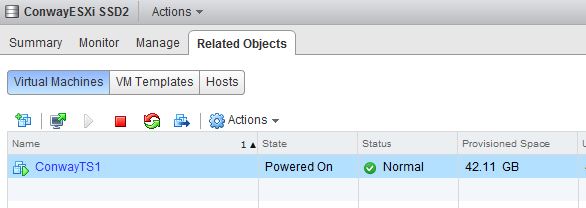
Next up is SSD2 which is my Samsung 850 Evo 250GB:
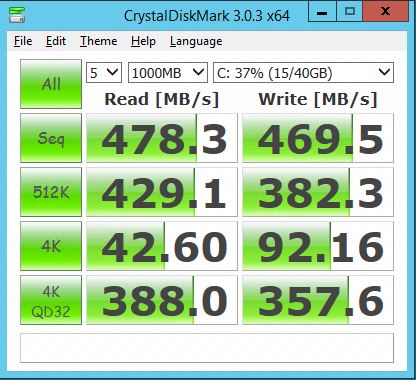 Even better – a Sequential read of 478 MB/s and write of 469 MB/s. Remember, this is just plugged into the TS140 ESXi box’s motherboard – no special Samsung software or anything. I have seen this drive do 540MB/s read and 480 MB/s write, but this is great still. The 4K rear and writes approve as well. Next up, RAID10:
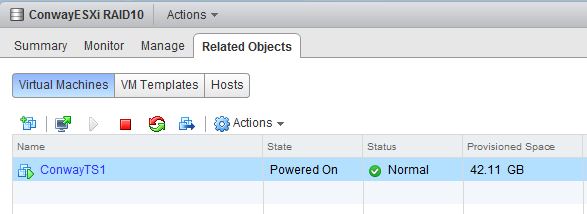
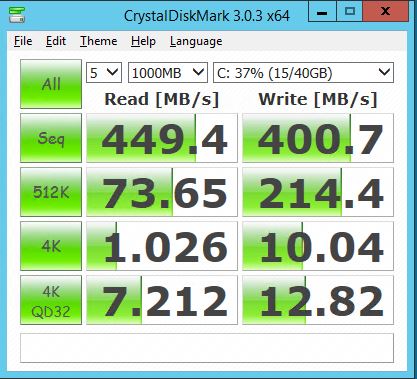
I think this is pretty nice – RAID10 of eight WD Black 1TB disks resulting in 449 MB/s Sequential read and 400 MB/s Sequential write. Here though, 4K random reads seem oddly low but I am going to look into that later. Because this is a larger array used for storage, I am using it mostly for large sequential transfers. And, finally the RAID5 array:
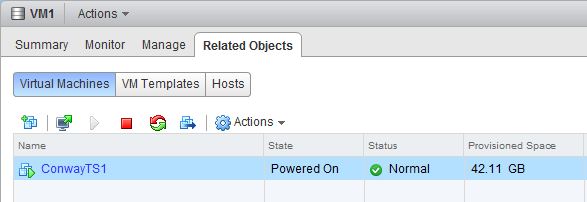
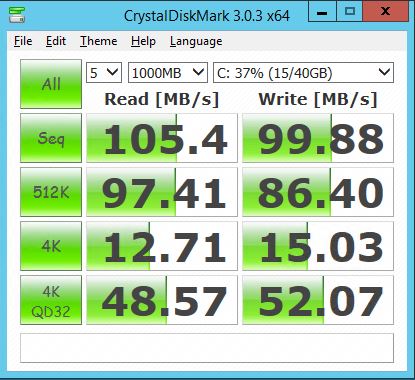
So if you’re paying attention at this point you’ll see that ConwayTS1 is on VM1 (RAID5 datastore) and is alone. However, there are 7 datastores on this DS1513+ RAID5 array and many VMs some of which are pretty busy. So, I don’t think this is a fair test at this point but I don’t have space to migrate all the VMs right now so I will post the results but please understand this array is chatty.
So, throughput of an eight disk (7200 RPM SATA) RAID10 is nice but costs you half of the total size and a bunch of physical space in your server. The SSDs are both nice (with my preference being the Samsung for obvious reasons) but clearly 250/256GB of space is a little light. But, none of this really shows us how the arrays/disks perform in terms of IOPS. When we’re talking about virtualized environments with many VMs on few storage devices, IOPS become important. Input/Output Operations Per Seconds is what allows common storage to be able to cope with many VMs tugging at the files within. Notice that earlier in this article we mentioned tens of thousands of IOPS, if not hundreds of thousands, in regard to SSDs. Imagine SSDs in RAID10! So, for Part II of this article we’ll be benchmarking the storage in terms of IOPS which will give us a better idea of how each array will survive business rather than just sheer bandwidth. Stay tuned!
 I am a Sr. Systems Engineer by profession and am interested in all aspects of technology. I am most interested in virtualization, storage, and enterprise hardware. I am also interested in leveraging public and private cloud technologies such as Amazon AWS, Microsoft Azure, and vRealize Automation/vCloud Director. When not working with technology I enjoy building high performance cars and dabbling with photography. Thanks for checking out my blog!