Hello all and welcome to Part 1 of my LogInsight 4 series. If you wish to visit past or future sections, use the links below:
vRealize LogInsight 4: The best syslog solution you didn’t know you had
vRealize LogInsight 4 – Part 2: Deploying – Single or First Node
vRealize LogInsight 4 – Part 3: Working with Agents
In this section we’ll talk about and discuss the planning that goes behind a successful LogInsight 4 deployment. Having a consolidated logging server is only beneficial if the asset cannot be exploited, right? Because heck, if someone can gain access to your logging solution, or worse, pretend to be it, well, you’ve just placed all of the mystery of your environment right in their lap.
Security is an “essentially contested concept”
Consider the nature of what is being sent to a logging server. We’re going to be receiving success/failure of logons (with usernames, potentially), application level errors (with versioning, etc.), firewall ACL logging (pass/block/reject), trapped errors, untrapped errors, clearly defined events, not-so-clearly defined events, etc. In short, we’re going to be receiving some pretty damning information should it get into the wrong hands. It is for this reason that I recommend your logging solution be deployed with security and privileged access as an utmost importance and at the forefront of your mind at all phases. For instance, you may not realize that you’re receiving logs of cron jobs from Linux VMs via the LogInsight API Agent that contains plain-text credentials because of a lazy developer, however, an intruder might.
With the above in mind, consider the following diagram:
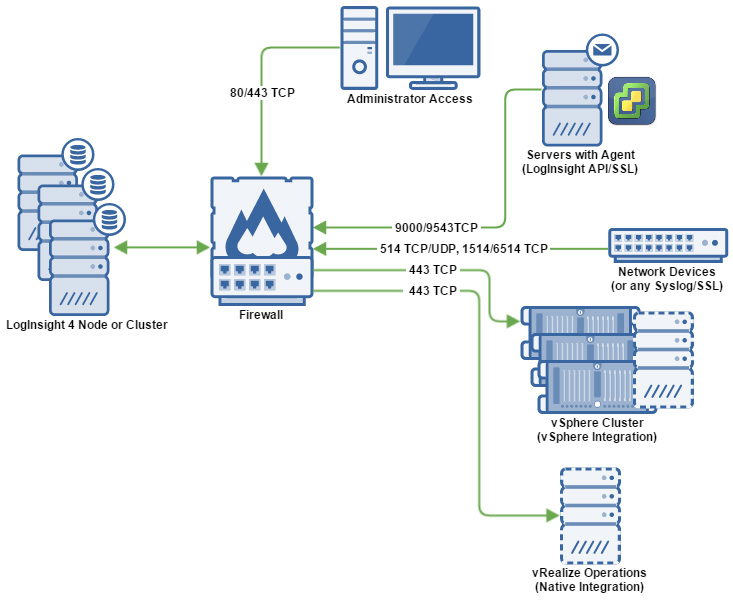
The above image should give you a quick and dirty visualization of the ideal placement of your LogInsight 4 node or cluster. I extracted the required ports and protocol used solely for communication between endpoints and the LogInsight 4 cluster. This does not include ports needed for AD authentication, DNS or NTP time resolution, SMTP, etc. It also does not include ports needed for inter-node communication. It does, however, include the ports and protocols needed for capturing data from VM guests with the LogInsight 4 agent installed, conventional syslogs, and native vSphere/vRealize Operations integration.
As you can see, the only ports needed for administrator access are HTTP/HTTPS. Technically, you may want to open SSH for administrator access as well, but I prefer to leave that closed access the node(s) from within that VLAN behind the firewall. It important to note that the ports above are for SSL and non-SSL connections. If you require only SSL and cannot otherwise specify the protocol used at the logged device or node, you may need to block some port access. There is a blurb at the end of this article about allowing only SSL connections – this only applies to cfapi protocol (agent-based) traffic.
Again, I cannot stress enough how important it is that you isolate your logging solution from the rest of your network. Don’t forget – that’s not where security stops! There’s no difference between poor security and permissive negligence! Securing your logging solution doesn’t stop with firewalling – you must also be sure that you’re not granting access to individuals who shouldn’t have it. Remember, there is the potential here that logs may contain usernames and passwords for systems that should have restricted access to them. Giving access to LogInsight 4 to your Service Desk employees might be convenient if they need to troubleshoot DNS or wireless controller issues, but should they see your sysadm account in a poorly constructed bash script or cron job? No. Be careful who you grant access to! There, I did my part.
VMware has great documentation regarding all of the ports needed, but I summarized in a simple more compact manner below:
| Source | Destination | Port | Protocol | Function |
| Admin Workstation | LogInsight 4 | 80/443 | TCP | HTTP/HTTPS access to LogInsight 4 |
| Hosts/devices to receive logs from | LogInsight 4 | 514, 1514, 6514, 9000, 9543 | TCP | All TCP syslog/agent ports SSL or otherwise |
| Hosts/devices to receive logs from | LogInsight 4 | 514 | UDP | All UDP syslog/agent ports SSL or otherwise |
| LogInsight 4 | NTP server | 123 | UDP | NTP time sync |
| LogInsight 4 | Mail Server | 25, 465 | TCP | SMTP/SMTPS to mail server for alerts |
| LogInsight 4 | DNS Server | 53 | TCP/UDP | DNS resolution |
| LogInsight 4 | AD Server | 88, 389, 636, 3268, 3269 | TCP | All TCP AD/GC/Kerberos connectivity |
| LogInsight 4 | AD Server | 88, 389 | UDP | All UDP AD/GC/Kerberos connectivity |
| LogInsight 4 | vCenter Server | 443 | TCP | vCenter Web Service |
| LogInsight 4 | vRealize Operations | 443 | TCP | vRealize Operations Web Service |
As you can see, once you break it down, there’s not too much to keep track of. One thing I recommend is creating a port-object or alias (or whatever your firewall calls it) for TCP and UDP, respectively, for your implementation. For instance, you might create a port-object called “loginsight_egress_tcp” that contains ports 25, 88, 389, 443, 465, 636, 3268, 3269 (all TCP ports associated with egress from the LogInsight instances) and allow them to your network (where your Mail, AD, vCenter, etc. might live). Or, obviously, you could break it down more granular and have a port-object for just AD ports, etc. The point is that when it comes to any vSphere product, the port exceptions at firewalls can become pretty significant as you roll more solutions out and creating aliases or object groups will help you understand what your firewall rules are doing at a glance which will ultimately assist in keeping things secure. Further, having good descriptions/names will help you understand how the solution works and troubleshoot in the future.
For a full port listing including those required between nodes, etc. you can check out the VMware vRealize Log Insight 4.0 Information Center.
Please note that LogInsight 4 supports inbound connections secured with TLS v1.0, v1.1 and v1.2. VMware has a working KB on disabling TLS v1.0 – I advise anyone deploying LogInsight 3.3.6 or later to follow the instructions linked here!
Scale or fail
When you deploy VMware LogInsight 4 you are going to have to make a decision – what size instance do you deploy? How much data do you need to ingest, at what rate, and how long will you need to keep it for? If you read my opening to this series you’ll remember how we touched on this topic being especially difficult to discern. The good thing with LogInsight 4 is that you don’t really need to know how much stuff you’re going to suck up at first – you only just kinda-sorta do. For instance, there are four sizes available:
| Size | No. of ESXi Hosts | Events/second | GB/day | CPU | RAM | Disk |
| Extra Small | 20 | 200 | 3 | 2 CPU | 4GB RAM | 132GB Disk |
| Small | 200 | 2,000 | 30 | 4 CPU | 8GB RAM | 510GB Disk |
| Medium | 500 | 5,000 | 75 | 8 CPU | 16GB RAM | 510GB Disk |
| Large | 1,500 | 15,000 | 225 | 16 CPU | 32GB RAM | 510GB Disk |
Right off the bat we can eliminate Extra Small and Small instances if you’re going to cluster because VMware does not recommend using either of these sizes in a cluster. In addition, VMware doesn’t recommend using Extra Small for anything other than a proof-of-concept or lab environment. So, really, for a production deployment, you’ll be deploying Small if you want a single node, Medium if you think you’ll be clustering or want the option to, or Large if you know you have a serious amount of data to ingest. The reason Small clusters are not recommended is because if the cluster loses a node, two Small instances might be too heavily taxed considering a cluster was employed. Personally, Medium is the sweet spot – at 8 CPU and 16GB of RAM it is not a huge write-off, allows for additional nodes of the same size to be scale out in the future, and offers the same initially provisioned disk space as the other instance sizes. I have a feeling that if you’re deploying a Large instance, you already know what you’re in for – 225GB/day of logging is insanity.
All instances can have their disk space extended by up to 4TB total with any given virtual disk being 2TB or smaller.
Do yourself a favor – don’t focus so much on the “Number of ESXi hosts” column above. While all of the columns are a basic guideline, the column you need to worry about is Events/second. If you are on a resource budget and want to make sure you don’t over-size your instance, deploy the Small instance, point your logs to it for a day or two, and see where you sit. After a few days, if you’ve got all or most of your devices/nodes pointing to the LogInsight server, you should start to get an idea on how many days you can retain the data for at the given logging rate.
The reality of the situation is that while ESXi hosts make chatter, firewalls can be much, much noisier. In fact, I would caution you by saying that your underlying storage may be more of a bottleneck than the instance size from time to time. So, if you’re worried, do a little testing. If you’re not, deploy Medium and move on. If you’re going to aggregate many sites up to a master site then you may look at deploying Large instances to accommodate the cumulative effect of upstream log shipping. Consider the following scenario:
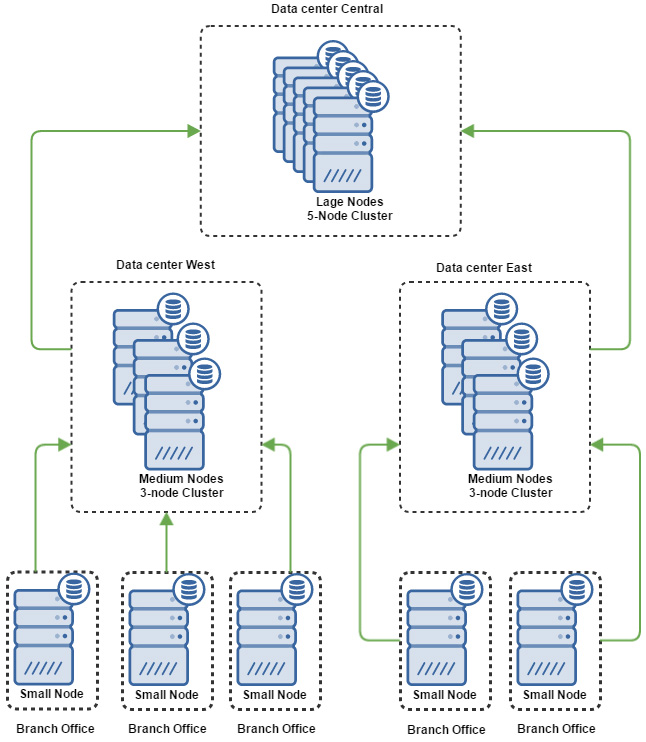
If you assume in the above image that there are a dozen or more “Branch Office” locations representing different locations where a company may have a couple ESXi hosts, switches for voice and data, firewalls, wireless controllers, access points, SAN or NAS storage, etc. then you can see how the number of events flying around can really start to take off. The top level of Large nodes does not have to represent a third data center or location; it can just represent the top-most single-pane of glass that a corporation might use to have auditing across their entire topology. Think of this as a conventional topology when dealing with something like a top-down monitoring/aggregation solution such as an IBM BigFix implementation or even an upstream WSUS server, etc.
A note on aggregation and forwarding: by default, if you’re forwarding to another LogInsight cluster or node you will likely use the cfapi protocol (agent-based) – however, a self-signed certificate will not work here by default since the remote server cannot be trusted in this manner. You must import the cert into the forwarder instance keystore. Further, if you choose to forward your events to an external entity for monitoring/analytics, do realize that forwarding via syslog port 514 TCP/UDP is supported, it is not secure and should be avoided.
Who is Cassandra?
One of the questions I had in the forefront while learning about LogInsight 4 was, “How does this cluster and how does it HA?”. In fact, I even pinged Steve Flanders to ask a number of questions while designing my solution – check out his blog for an immense amount of info (thanks a ton Steve)!
In order to build out a solution that scales well, VMware decided to leverage Apache Cassandra for its durable, fault-tolerant, elastic, high-performance capabilities. Apache Cassandra is a NoSQL database that uses columnar data storing which is one of lowest level data spaces – it literally has a column that consist of a name, a value, and a time stamp. Pretty basic.
One of the catch phrases in the IT industry is the word “elastic”. It can mean many things, but when talking about Apache Cassandra, the term elastic refers to its ability to improve performance by expanding distribution across a number of nodes – this is how it scales so well. So, naturally, the more nodes you add, the better the performance you’ll experience as the NoSQL database becomes striped across the cluster (with the assumption that you have adequate storage to support the IO demanded). Your queries get cached so you can pull data faster and you’ll be able to see cache hits or misses within the LogInsight statistics view. When operating in a cluster, the master node is responsible for querying subsequent worker nodes. If you master becomes unavailable, worker nodes still receive ingestion, but querying is not possible until the master is restored.
LogInsight maintains HA of ingestion and scale-out of nodes but it does not replicate the data. So, if you have a 3-node cluster and lose a node, you’ve lost 1/3 of your logged data. However, the configuration of the cluster is distributed across all of the nodes so repairing a failed node is not necessary. Because ingested log data is stored on each node in /storage/core in chunks, it’s really best to backup the whole appliance or at least snapshot your volume(s) that your LogInsight cluster reside in so you can recover them should something go awry.
To cluster or not?
If you’re wondering whether or not you should configure a production LogInsight deployment in a cluster or not… you should, of course. However, VMware made this an easy issue to worry about later because there’s nothing specific about a new deployment that has clustering in mind except for instance sizing. I do have one recommendation, however: point all of your logged devices to LogInsight by DNS if possible. This way, in the event that you do end up going to a cluster, you don’t need to get on each and every device and reconfigure the syslog server and can, instead, update DNS with the integrated load-balancer IP (ILB) when needed. This might not be an (easy) option if you are running a multi-tenant solution as you may not have DNS available across domains and you may not be able to create zones in order to circumvent that, but put up a bit of a fight if you can (and if your devices support syslog to DNS).
Cluster roles and placement
When talking about LogInsight in terms of clustering there are really only three terms you need to know about: the master, the workers, and the ILB (integrated load-balancer). The master node is always the first node deployed. If you don’t deploy a cluster then you only have a master node. As mentioned before, when deploying a clustered LogInsight solution, VMware recommends medium-sized instances – this is because they want to make sure that your cluster can continue to perform if it were to become short a node. This is conservative on VMware’s part, but it’s the guideline they use.
The master node is the gatekeeper to all entry into the cluster. Without your master node available, you cannot add, remove, or upgrade nodes in the cluster. It is imperative that you backup (at the VM level) your master node and worker nodes should you be required to retain your logged data. Do note that the master is not necessarily the node where the ILB resides should you choose to enable clustering and the ILB. If the master is not available you cannot query the cluster. Your cluster will still receive and ingest logs, but you can’t search.
Worker nodes are those that are subsequently joined to an existing deployment. In LogInsight 4 you can have a total of 12 nodes – a single master node and 11 workers. Workers join the cluster and are approved from the master node. Once approved, they’ve been issued the certificate used, their time has been sync’d (via NTP, right?) and they show up in the cluster view:

Note that in the above image it is indicated that LogInsight 4 does not support 2-node clusters, though it does work for testing. I believe the reason for this is so that should a node fail, it can’t be both the master and the ILB. Remember, the master is needed for approvals into the cluster and if it’s also the ILB and fails, so will logging (if you’re pointing devices to the FQDN or IP of ILB). You don’t need an ILB – you can point different logged sources to each node of the cluster and the master can query across the LogInsight nodes, but it is recommended you utilize the ILB since it’ll distribute logging duties to each node in a round-robin fashion. For a proper supported LogInsight solution, 3 nodes are required.
One suggestion: Create DRS rules within vCenter to keep the LogInsight nodes on separate hosts. If you don’t have three ESXi hosts in your cluster, then create a separate VM group for each the master node and worker nodes and then create a DRS rule to keep those VM groups separated. This way, should an ESXi host fail, you don’t risk your logging solution being unavailable because DRS put all your nodes on the same host. Additionally, depending on how big your environment is, you may consider putting each node in its own datastore. Since vSphere controls IO queuing per datastore, it may be best that the nodes be split up so that they can each get their own queue rather than creating one giant bully datastore. Further, make sure your storage on the back end is up to the task. A medium size implementation can see 1,000 – 1,500 events/second, which results in a bunch of IO/second. Keep this in mind – if you use Storage IO Control you may consider limiting or prioritizing the node traffic based on performance and demand.
Finally, it is important to note that when dealing with a LogInsight cluster, any upgrades that are to occur within the cluster start with the master node and you must connect to it by its FQDN, not the ILB FQDN. Once the master is upgraded then the rest of the nodes can be upgraded.
Planning for ingestion
At this point in the planning phase you’ve already hashed out your security concerns and exceptions through various firewalls. You’ve decided whether or not you’re going to operate LogInsight as a cluster or not. Next up is worrying about how you’ll get the data flowing. For most network devices you’ll be utilizing syslog over port 514 TCP/UDP. Some devices might use SSL, some might not.
When it comes to guest logging, the decision is easy. If you’re using Windows guests, you’ll utilize the vRealize LogInsight Agent. You can get the agent from your own LogInsight instance! In fact, the MSI package you pull down will have the FQDN already configured so you just deploy via GPO or individually.
When it comes to Linux guests you have an option – you can use rsyslog with or without TLS (SSL), but you should probably just use the vRealize LogInsight Agent for Linux (which is available in .rpm, .deb, and .bin formats).
Further, you can decide whether or not you’d like to accept only SSL traffic for Agent ingestion from the Administration menu and toggling Require SSL Connection. This does not interfere with syslog traffic for port 514 TCP/UDP, it only affects connection attempts via Agents (cfapi protocol). As of LogInsight 4, the default for vRealize LogInsight Agent connectivity is to use SSL, which can be seen from the LogInsight Agent log file generated in C:\ProgramData\VMware\Log Insight Agent\log\liagent_[yyyy]-[mm]-[dd]_00.log for Windows agents (for Linux look in /var/lib/loginsight-agent/log/):
| 2017-02-09 15:14:32.809010 0x00001350 <trace> Config:337 | Configuration key server.ssl is not specified. Using default: yes |
| 2017-02-09 15:14:32.809010 0x00001350 <warng> ConnectionOption:59 | Config param server.port is not specified. Using default: 9543 |
| 2017-02-09 15:14:32.809010 0x00001350 <trace> Config:246 | Configuration key server.reconnect is not specified. Using default: 30 |
| 2017-02-09 15:14:32.949624 0x00001350 <trace> AgentDaemon:443 | Starting transport… |
| 2017-02-09 15:14:32.949624 0x00001350 <trace> AgentDaemon:464 | AgentDaemon configured successfully |
| 2017-02-09 15:14:32.949624 0x00001350 <trace> AgentDaemon:385 | AgentDaemon started successfully |
You can confirm further down in the log as well via the “connection” details:

The important part to note above is the line showing cfapi-ssl://[your-log-server-FQDN]:9543. Once you see that, you know you’ve got a secure channel between your vRealize LogInsight Agent and the LogInsight solution – if you were receiving encrypted data you would observe the connection being established over port 9000 TCP.
Again, when planning for ingestion, consider your logging level on network devices and what sort of auditing you’ll enable on guests. The only way to really know what’s going to happen at the LogInsight server is to let her eat! Remember, if your environment is especially heavy in network/device logging rather than agent logging, pay special attention to the syslog configuration limits. Any given worker can only have 750 concurrent syslog connections. This is where scaling out becomes important.
When you first open the flood gates LogInsight is going to look at the rate at which logs rush in. Because you were logging nothing initially it will incorrectly calculate your retention period for a bit. Once your rate has stablized and you’ve stopped adding 20 devices/nodes an hour, you will start to see a more predictable pattern with the statistics page of the administration console, and LogInsight should adjust your expected retention period accordingly. We’ll talk about this more in later parts.
This pretty much sums up the security and planning phase of a successful LogInsight 4 deployment. If you haven’t already, I highly suggest you read the documentation over on the official vRealize LogInsight 4 Information Center. This portion of the guide is not intended to define what a successful LogInsight 4 deployment should look like and instead only suggests some considerations that should be made in order to help. Please, by all means, feel free to leave a comment if you think anything was missed from this section and I will surely add to it, take away from it, or clarify. I appreciate any and all input!
Thanks for reading and stay tuned for the next part of this series, vRealize LogInsight 4 – Part 2: Deploying Standalone and Cluster Nodes!
 I am a Sr. Systems Engineer by profession and am interested in all aspects of technology. I am most interested in virtualization, storage, and enterprise hardware. I am also interested in leveraging public and private cloud technologies such as Amazon AWS, Microsoft Azure, and vRealize Automation/vCloud Director. When not working with technology I enjoy building high performance cars and dabbling with photography. Thanks for checking out my blog!