If you’ve somehow landed here after searching something related to LogInsight, then welcome to Part 2 of my LogInsight series! Feel free to check the following links to look at earlier (or later) parts of this series. If you’re following this series in order, then welcome back!
vRealize LogInsight 4: The best syslog solution you didn’t know you had
vRealize LogInsight 4 – Part 1: Security and Planning Considerations
Deploying this puppy
As with most vSphere solutions, VMware offers LogInsight 4 as an OVA that you deploy from within vCenter. You can download the necessary files from this link, though you’ll have to log in with your VMware account. We’re interested in the download titled VMware vRealize Log Insight 4.0.0 – Virtual Appliance (vRealize LogInsight 4.3 has been released as of the date this article had been published but installation is the same for the most part).
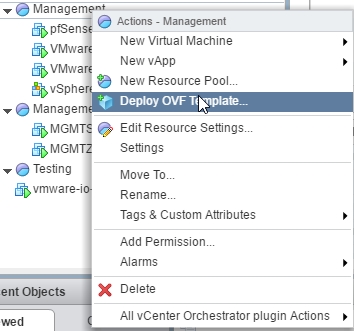
Once you’ve grabbed the download, head on over to your vCenter server (I am running VCSA 6.5), right-click your cluster, resource pool, etc. and choose Deploy OVF Template. We’ll be deploying this appliance in my “Management” Resource Pool:
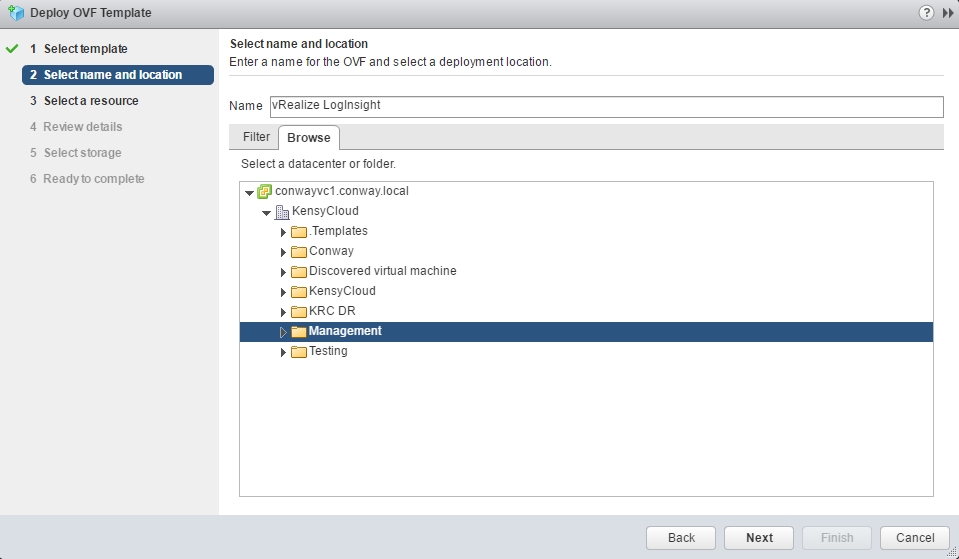
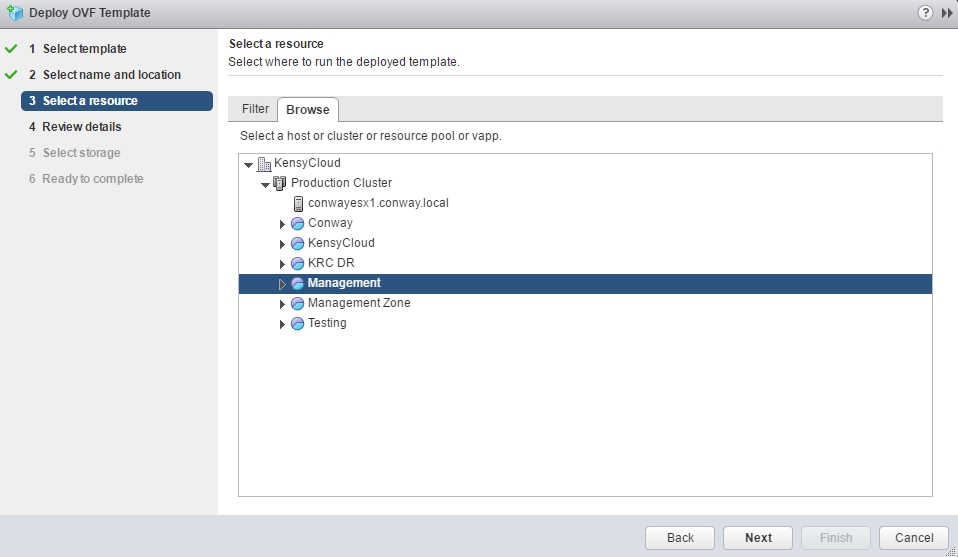
Next you just choose the local file, give it a name, pick your VM folder and resource pool for the Virtual Appliance:
The most critical part about deploying the LogInsight is picking the correct deployment size. You’ll see that in addition to the typical vCPU and RAM changes, the deployment size also changes the provisioned disk space and also gives you a guideline on the number of events per second as well as GB/day of logging:

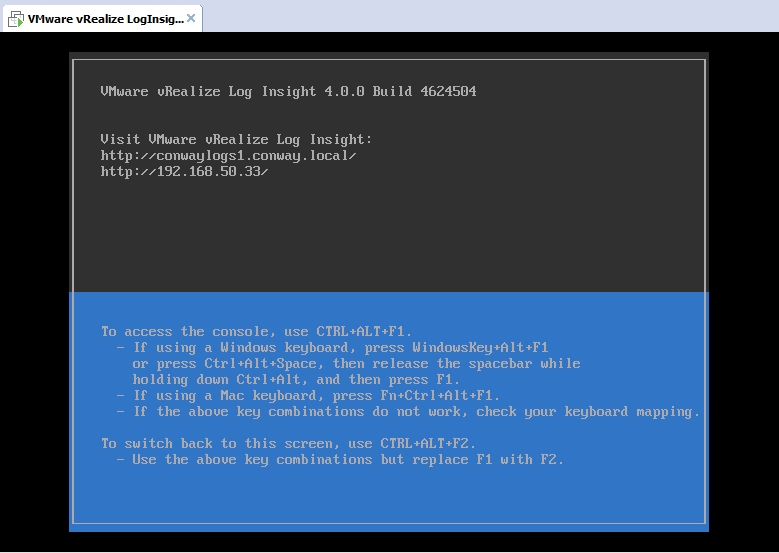
After you’ve selected the deployment size (I use Small for my lab(s) because I am going to be clustering later on) you just follow the typical configuration involving storage location, IP address/DNS/domain/etc., and complete. The appliance will deploy and once turned on, it’ll reboot to run the customization based on your configuration. Once you’re done, you’ll see the console:
Once your installation is complete, you’ll be able to access the initial setup configuration at https://[LogInsight-IP]/admin. You should see a screen similar to the image below:

After you click Next you’ll have the option of creating a New Deployment or Join Existing Deployment. Because we’re deploying our first or single node, we will choose to create a new deployment:

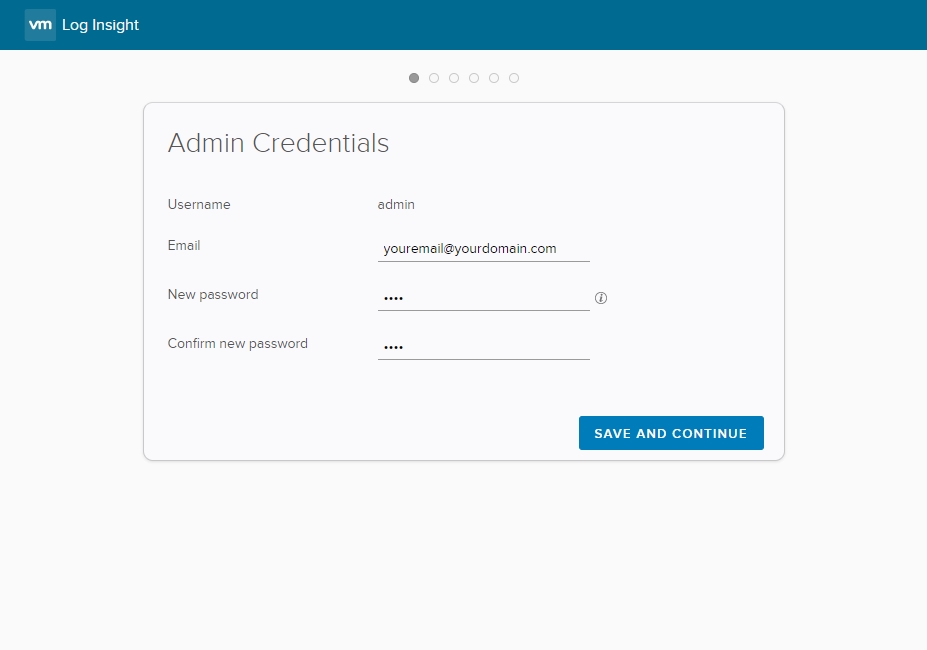
Next, fill in your admin information. You’ll want to use your real e-mail address as this will be a sort of “catch all” for any system alerts or password recovery and such:
Now for everyone’s favorite prompt during an install:
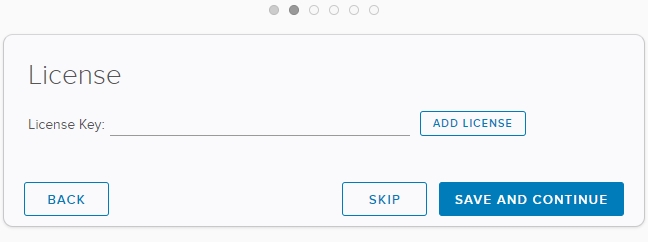
If you have your license available, enter it now – if not, you can hit skip and deal with it later. Remember, your vCenter key will allow you to monitor 25-OSIs (but restricted to the vSphere content only).
Once complete, you have the option to enter an e-mail (or many) for operational notifications and alerts to be sent to. You can also configure an HTTP Post URL for sending alerts to other systems:

You can see above I chose to opt out of the VMware Customer Experience Improvement program.
Next up is time configuration. This is big. This page here (which can be adjusted later) is where you sync your LogInsight server to network time. Be sure to use the same or similar NTP servers that your vSphere infrastructure uses. If you’re not familiar with logging solutions, the key to keeping time is that everything should be logged in UTC. It’s annoying to read and figure out at first, but once all of your systems are in UTC it makes complete sense. I use pool.ntp.org for my environment so the default works fine. You can also hit the Test button to make sure DNS is resolving for you:

Finally, you configure your SMTP Configuration settings. Fortunately for labbers, LogInsight allows you to configure secure relays and specify the port unlike vCenter which only alerts out port 25 with anonymous access. You could, then, configure LogInsight to send notifications directly through your Gmail account via SSL and everything.
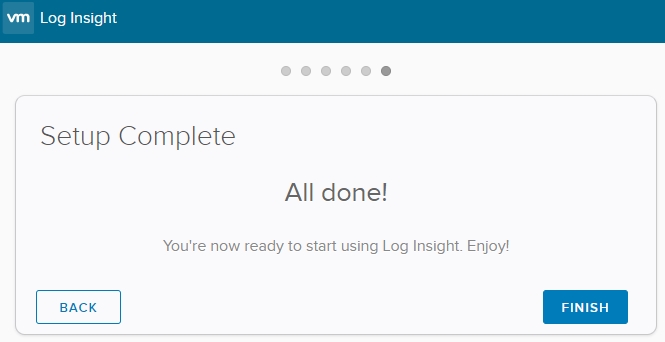
All done – yay! We’re now ready to log into our newly created LogInsight solu… wait a second:

Ok, the UI may have lied. We’re not all done. However, if this were Graylog, Splunk, or Logarithm we’d have to start installing agents, working with grok code, creating dashboards, etc. However, because this solution is geared toward consolidated monitoring of your vSphere environment you can see that there is a link for “Configure vSphere Integration“. Click that and follow on!
Note: If you have familiarity with LogInsight 4.0 you’ll notice that things are slightly different from this point forward. That’s because I am now capturing configuration from a fully deployed environment which was recently upgraded to LogInsight 4.3. For the most part, everything is exactly the same – upgrading to LogInsight 4.3 really only addressed minor bug fixes and made some slight UI tweaks. You can read more about the changes here.
Hooking ‘er up to vSphere
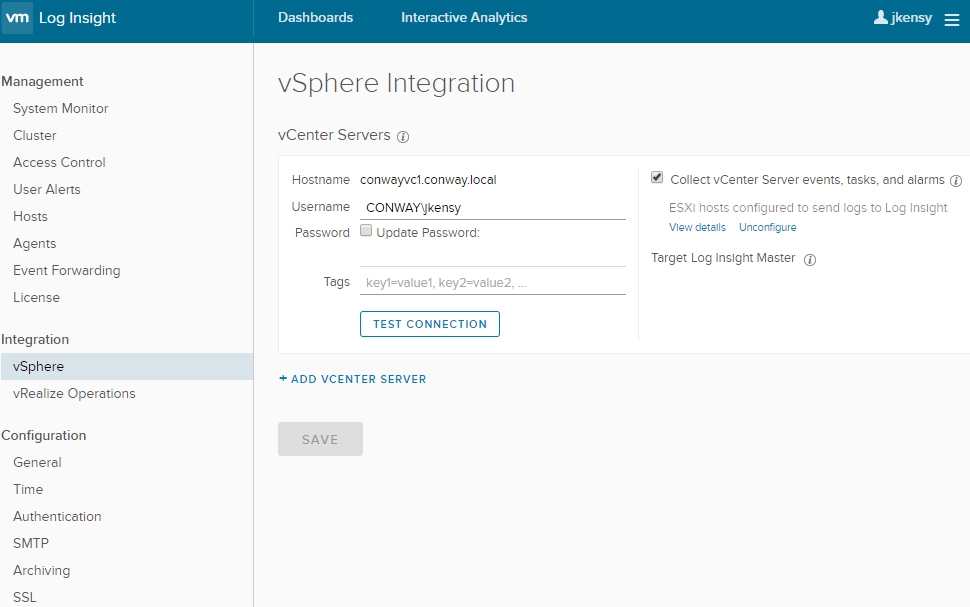
As shown a minute ago, we can click the link to configure monitoring for our vSphere environments. You are able to connect a given LogInsight 4 deployment to up to 10 different vCenter Servers. You can choose to use the SSO admin account (usually administrator@vsphere.local) or you can use an account with administrator access using DOMAIN\user credential method to the vCenter and ESXi hosts you’ll be managing. You can likely create a specific role for a LogInsight 4 admin account, but I just use the administrator role because the account will connect to the vCenter and hosts and configure the syslog server:
If you wish to use Active Directory for authentication for your users, then you need to configure that first under Configuration then Authentication on the Administration menu (the three-bar button in the top right corner):
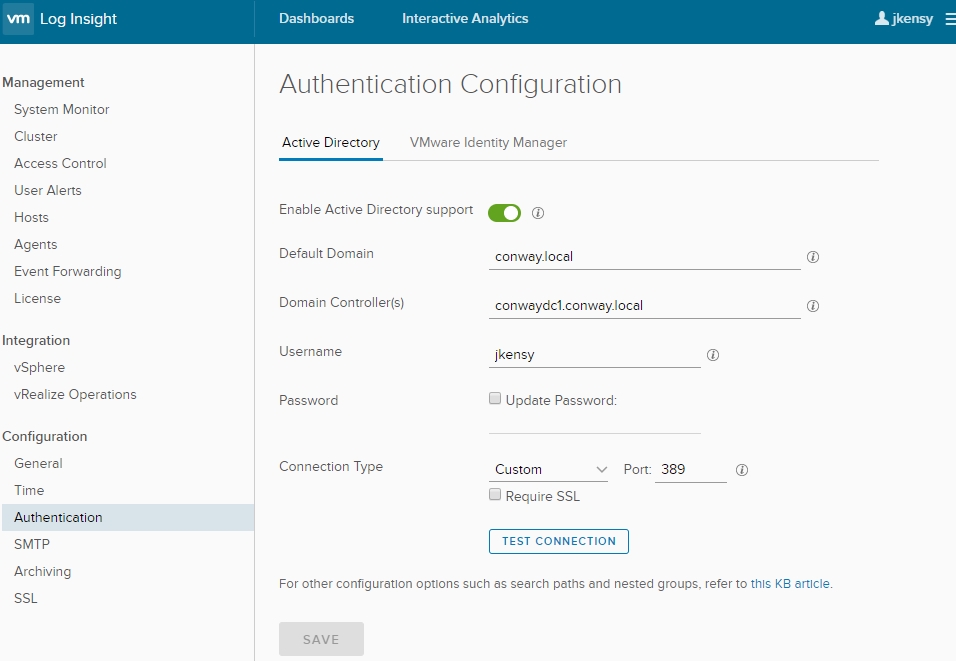
It’s that simple. Next, you might create an AD group called LogInsight Admins or LogInsight Read-Only. Once you’ve decided your group configuration, you can then grant access within LogInsight by going to the Administration Menu, Management, then Access Control:

Because this is a lab environment, I do not have read-only accounts or groups configured and instead am allowing all domain admins the User, Super Admin, Dashboard User, and View Only Admin roles. Configure your environment as needed.
Once you’ve performed these basic steps you’re ready to start sifting through the logs that are being sent in from your hosts. Before we assume it’s all working, let’s check the configuration on our host(s):
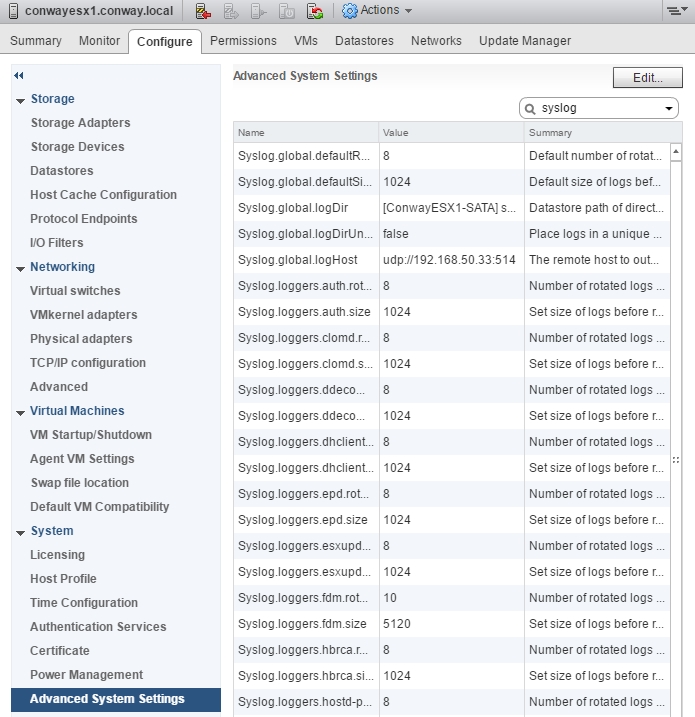
Confirm that your Syslog.global.loghost parameter is configured to send logs to your LogInsight server. Once that’s is confirmed, you should be able to see logs flowing in from the VMware – vSphere dashboard called General – Overview:
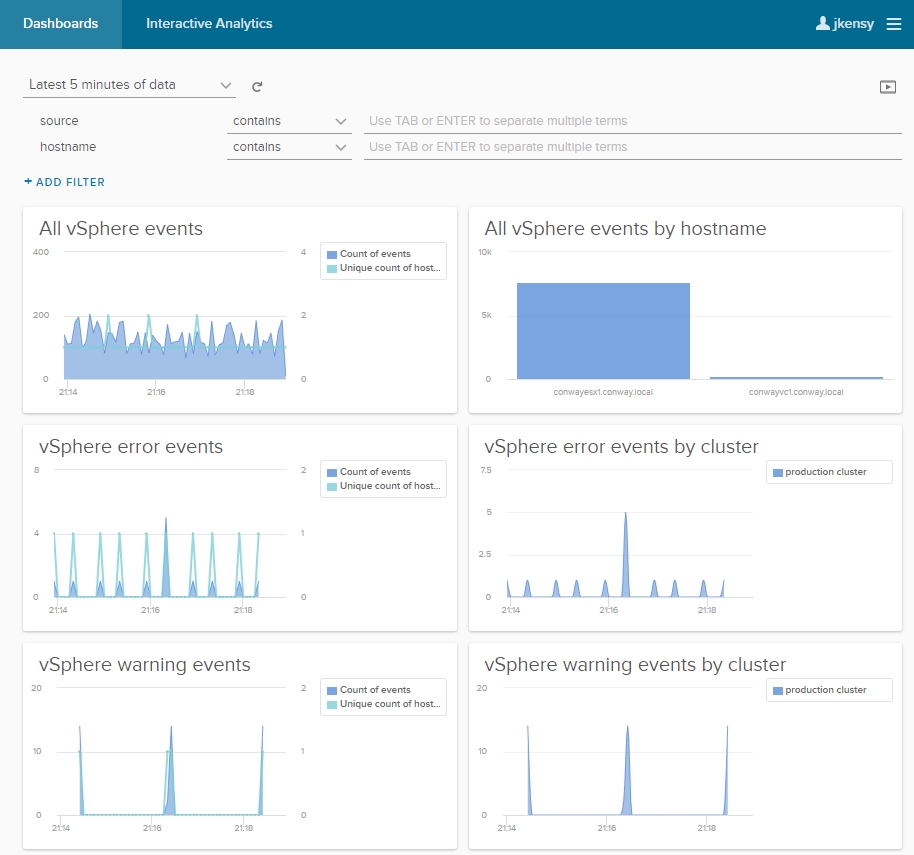
Note that it may take several minutes for LogInsight 4 to start parsing the incoming stream. Remember, up until this point we’ve only configured ESXi hosts to send logs via the vSphere Integration configuration. We are not receiving alerts from vCenter itself nor are we receiving any alerts from guests (Linux or Windows). That’s for another article coming up!
All in all, you can see how easy it is to get this going. There’s no funky LDAP/S configuration to setup, no ELK stacks to deploy, and no fuss overall. If you are having any issues getting logs from your ESXi servers at this point please refer to the first part of this series for topology/network considerations. By default ESXi will be configured to send over UDP 514.
Thanks as always for reading and stay tuned for the next part in this series where we install and configure agents! Don’t forget to read the rest of the series by following the links below!
vRealize LogInsight 4: The best syslog solution you didn’t know you had
vRealize LogInsight 4 – Part 1: Security and Planning Considerations
 I am a Sr. Systems Engineer by profession and am interested in all aspects of technology. I am most interested in virtualization, storage, and enterprise hardware. I am also interested in leveraging public and private cloud technologies such as Amazon AWS, Microsoft Azure, and vRealize Automation/vCloud Director. When not working with technology I enjoy building high performance cars and dabbling with photography. Thanks for checking out my blog!